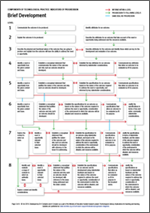
Learning Progression Diagrams
This series of diagrams presents the indicators for each component in form, showing how, at each level, the curriculum builds on earlier learning. Like the indicators themselves, the diagrams can be used as a tool for programme planning, to support formative and summative assessment, and as a basis for reporting.
Some teachers also use the diagrams as a cumulative record of learning in technology, highlighting each indicator as the student demonstrates the appropriate knowledge, understanding or skill. This can be done on a paper copy or directly on the PDF using the highlighter function under Tools (in Acrobat Reader or alternative utility).
This cumulative record is a useful prompt when it comes to student and parent conferences or writing reports. At the end of the year or rotation it gets passed on to the next teacher.
Learning Progression Diagrams (PDFs)
Outcome development and evaluation
Characteristics of technological outcomes
Complete set (all eight components)
Resources
Tracking coverage and learning across a school
A primary school uses the progression diagrams as a tool for keeping track of the students’ learning experiences across teachers and years.
Related videos
School-wide programme planning (04:18)
Cheryl Pym explains how collaboration forms the foundation for school-wide planning in technology education.
Reviewing programme planning in years 7–13 (03:23)
At Diocesan School planning focuses on technology components for years 7–10, and establishing scholarship potential in year 13....
High expectations in years 7–8 technology (03:57)
Steve Jeffares shares how he inspires students to develop a love of learning.


